Execution Queue, Logs and Statistics
You can keep track of what the ODX Server is doing and has done in a number of ways.
View Executing and Queued Tasks
In the Execution Queue, you can see the tasks that are currently executing, waiting to start or just finished executing.

To open the Execution Queue
- On the Tools menu, click ODX Execution Queue. The Execution Queue window appears.
To refresh the list of tasks in the Execution Queue
- Open the Execution Queue and click on Refresh of press F5.
To stop a task execution
- Open the Execution Queue, click on the running task you want to stop and click Stop.
View Scheduled Tasks
The Scheduled Tasks list shows you all the tasks scheduled to be executed.
To open Scheduled Tasks
- On the Reports menu, click ODX Scheduled Tasks.
View Previously Executed Tasks
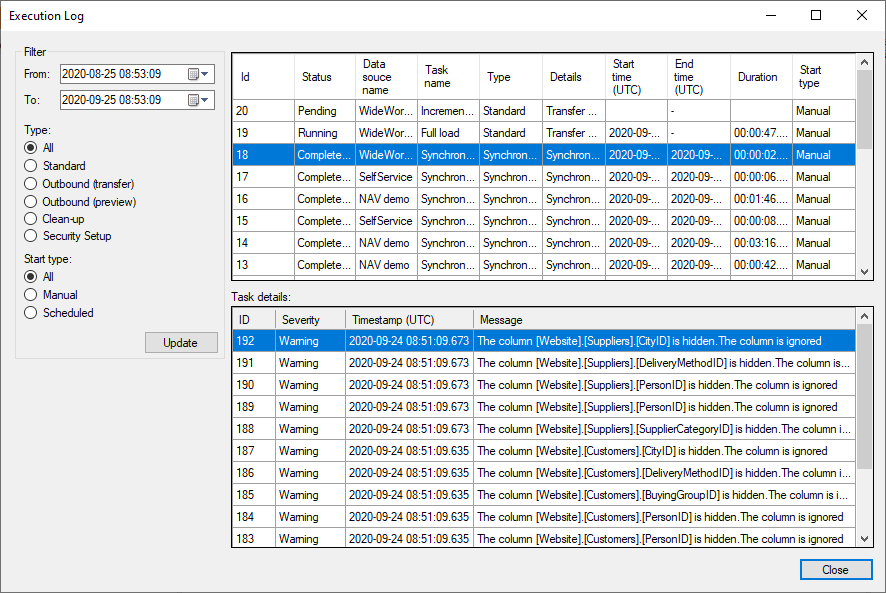
The Execution Log shows you all the previous task executions.

To open the Execution Log
- On the Reports menu, click ODX Execution Log.
In the left-hand side of the Execution Log window, some filter options are available:
- Time span (From and To dates and time)
- Type of task
- Start type
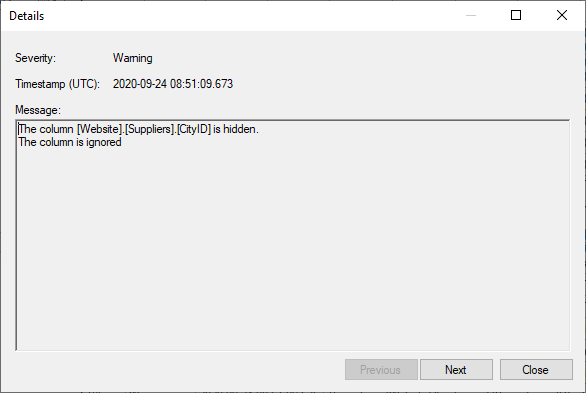
To see the full message for an item in the Task details list, double-click the item.

Click Previous or Next to navigate to other messages in the selected execution.
View Log of Service Calls
The ODX Server also logs the communication between the ODX Server Manager and itself.
To open the Service Log
- On the Reports menu, click ODX Service Log.
View Data Source and Data Storage Statistics
The ODX server collects some statistics on the data source and data storage. On the data source, you can see e.g. how many tables and columns are available. On the data storage the number of tables and columns and the total data consumption is listed.
To view the statistics
- Right click a data source or the data storage and click View Properties.
0 Comments