Manual Deployment and Execution
While you are developing and maintaining your project, you may want to deploy or execute the entire project or individual objects to confirm that everything works as expected.
Manual execution is configured in the default execution package, that can be configured just like any other execution package. See Execution Packages for more information.
Deploying and/or Executing Individual Objects
Whether you want to deploy, execute or deploy and execute an object, the steps are similar.
- Right-click the project or the project element you want to deploy and/or execute, and click Deploy, Execute or Deploy and Execute
- OR -
Click the object at press CTRL + ALT+ D to deploy, CTRL + ALT + E to execute and CTRL + ALT + K to deploy and execute. The Deploy and/or Execute window appears.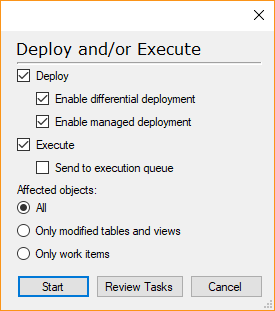
The settings in the window depends on how you initialized the window – choosing deploy, execute or deploy and execute – and your default settings for deployment. - Select Deploy to deploy the selected objects. You have two options for deployment. Their initial setting is based on your project settings.
- Select Enable differential deployment to take advantage of TimeXtender’s differential deployment feature that calculates what steps have changed and need to be deployed and selects only those steps for deployment. When differential deployment is disabled, all steps are deployed.
- Select Enable managed deployment to have TimeXtender calculate the correct order of deployment.
- Select Execute to execute the selected objects. The execution settings are governed by the default execution package.
- Select Send to Execution Queue to push the execution to the execution queue so you can continue working on the project while it is executed. For more information, see Executing Objects with the Execution Queue below.
- Under Affected objects, select which of the objects you selected for deployment and/or execution you want to deploy and/or execute. Your options are All, Only modified tables and views and Only work items.
- Click Start to begin the deployment and/or execution process as soon as TimeXtender is ready or Preview Tasks to review the tasks and settings before you start the process.
- If you use the differential deployment method, it will take TimeXtender a few moments to calculate what steps need to be deployed. If TimeXtender does not find any steps that needs to be deployed, you will be asked if you want to save the project as the deployed version. This has to do with the way the scheduler works. It will execute the last deployed version of a project, i.e. if you want the current version to be the one that is executed by the scheduler, it needs to be marked at such.
- The Deploy, Execute or Deploy and Execute window opens. If you clicked on Start earlier, TimeXtender will begin the deployment and/or execution process immediately. Otherwise, you can review the tasks before you start the process.
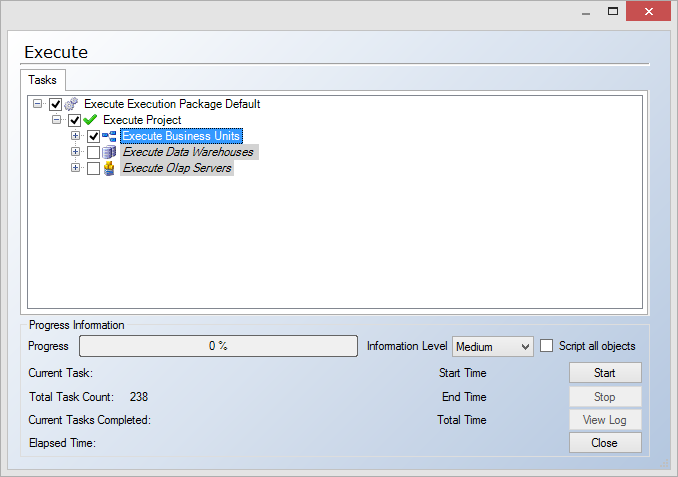
- Clear the selection for any objects you do not want to deploy, execute or deploy and execute.
- (Optional) In the Information level list, click your preferred level of information during the completion of the tasks. The following options are available:
- None: Displays no progress information.
- Low: Displays current task, the total task count, start time, end time, and total time.
- Medium (default): Displays progress information, name of the current task that is being deployed, number of completed tasks, the total number of tasks that have to be completed, start time, end time, and total time.
- High: Displays all deployment steps in the task window, progress information, name of the current task that is being deployed, number of completed tasks, the total number of tasks that have to be completed, start time, end time, and total time.
- (Optional) Select Script all objects to make all parts of the SQL script available in the log for debug purposes. This option disables the use of Shared Management Objects to create tables instead of executing "CREATE TABLE" statements against SQL Server since statements executed through Shared Management Objects are not in the log.
- Click Start to deploy, execute or deploy and execute the objects you have chosen. Click Stopif you want to halt the processing prematurely.
If there are any errors during deployment or execution, the Error window is displayed. Click Yes to view the log. The object on which the deployment or execution failed, has an Error Information node. Double-click Error Information to view an error description.
Customized Code Warnings
TimeXtender will display a warning message if you try to deploy a table with customized code where the table has changed in TimeXtender since you last customized the code. Often, you need to update the customized code when you have made other changes to the table and the purpose of this feature is to help you catch some errors earlier.
TimeXtender displays the warning message when the deployment window opens. Click OK to close the message. On the Customize Code Warning tab, you can see what tables might have outdated customized code.
If you click Start after closing the message, TimeXtender will assume that you have things under control and not display the message again for the same issue.
Reviewing the Execution Log
On each execution, the execution diagram, message and setup is saved to the execution log.
- To view the execution log for an execution package, open the Execution tab, right click the execution package and then click View Execution History Log.
Resuming a Failed Execution
Executions that fail are a fact of life, but restarting an execution that has failed can be very time consuming if the error occurred two hours into the execution. Therefore, TimeXtender enables you to resume a failed execution from the point of failure.
This is useful since, with managed execution, you cannot always determine in what order TimeXtender will execute tables. This means that if an execution fails, a complete restart of the execution is usually the only way to ensure that everything is executed correctly.
You can also configure TimeXtender to allow some non-essential data sources to fail without failing the entire execution at the same time. See Allowing a Data Source to Fail
When an execution fails, resume the execution by following the steps below.
- First, you need to identify the error. On the Execution tab, right click the failed execution package, and click View Execution History Log. The Execution Log window opens.
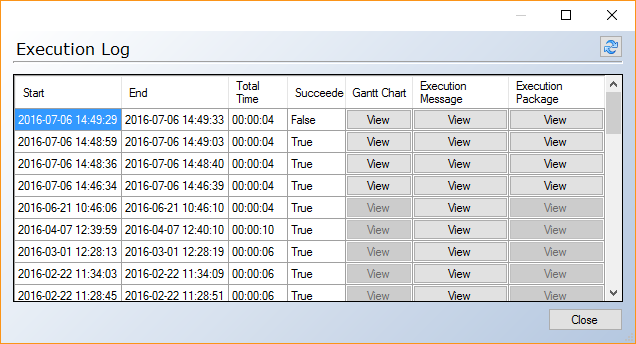
- Click View in the Execution Message column next to the failed execution to display the error message. Close the message and the Execution Log window.
- Second, you need to solve the error you identified in the execution message. Remember to deploy any changed objects as necessary.
- Now you are ready to resume the execution. Open the Execution Log again as described in step 1.
- Right click the execution you want to resume and click Resume Execution. The Execute window opens.
- Click Start to begin the execution.
- Repeat steps 1-6 if the execution package fails again.
Deployment Status Report
You can generate a deployment status report that contains a list of the objects to need to be deployed. This can be done on the project level, data warehouses, business units and SSAS Multidimensional servers as well as a remote environment.
The process is very similar to generating documentation, however, a deployment status report can also be generated in the CSV file format in addition to PDF and XPS.
Generating a Deployment Status Report
To generate a deployment status report for a part of or your entire project, follow the steps below.
- Right click on the object you want to create the report for, click Advanced and click Export Deployment Steps. The option is available on the project level, data warehouses, business units, SSAS Multidimensional servers, data exports and Qlik models. The Export Deployment Steps window appears.

- Under File type, click the file format you want to use. If you choose CSV,
- Select Open file after save to view the document when TimeXtender has generated it. TimeXtender shows the document using external viewers that needs to be present on the machine.
- Select Include object details to include details of the objects that the steps that need to be deployed are part of.
- In the Object descriptions list, you can choose how you want to use include the object descriptions. You have the following options:
- In separate RTF files attached to the document: The descriptions are attached to the document as RTF files. This option is useful if you have used rich text formatting or added pictures to your descriptions, but only available for the PDF file format.
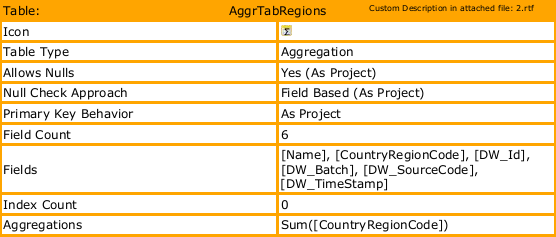
- Only text placed in the document: The descriptions are included in the documentation as plain text.
- No descriptions: The descriptions will not be included in the generated documentation.
- In separate RTF files attached to the document: The descriptions are attached to the document as RTF files. This option is useful if you have used rich text formatting or added pictures to your descriptions, but only available for the PDF file format.
- Under Style, you can configure the look of the status report. The settings are saved on a per-user basis and used for this as well as the files generated by the documentation feature.
- Under Page Orientation, select the page orientation you want the documentation to use.
- Click the color preview next to the different color details to choose a color.
- Click Change font... to choose a font for the documentation. a preview is displayed under Font.
- Click Preview Style... to generate and open a sample file with the colors you have chosen.
- Click Reset to Defaults to reset the style settings to their defaults
- Click OK. Wait while the steps are calculated. In the window that then appears, choose a file name and location for the report and click Save. The default name is the project name followed by "deployment steps" and a timestamp.
Please note that you will need to have working connections to the relevant databases when you generate the status report. Otherwise, TimeXtender won't be able to calculate the differences that indicate that a deployment is necessary.
Generate Deployment Status Report on Remote Environment
In addition to the local project, you can also generate a deployment status report for a project on a remote environment in a multiple environments setup. The report will contain information on the last available version on the environment.
- To generate documentation for a project on a remote environment, right click on the project, click on Multiple Environment Transfer, right click the remote environment and click Export Deployment Status.
Executing objects with the Execution Queue
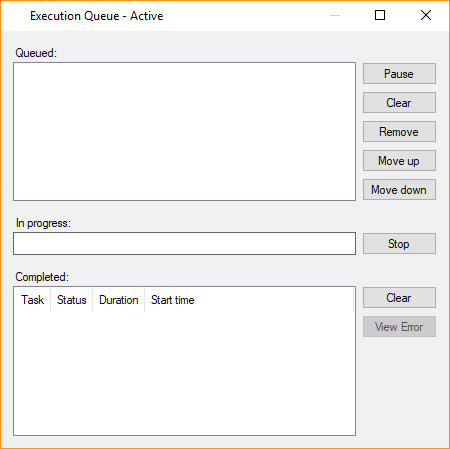
The Execution Queue enables you to continue working while tables or you entire project is executed in the background.
Opening the Execution Queue window
To open the Execution Queue window
- On the Tools menu, click Execution Queue.
Adding an object to the Execution Queue
Adding an object to the Execution Queue is a simple drag-and-drop operation.
- Drag-and-drop a table, a perspective, a data warehouse, a business unit, an execution package or another executable object to the Execution Queue window. A window appears to let you choose which execution steps from the object to add to the queue.
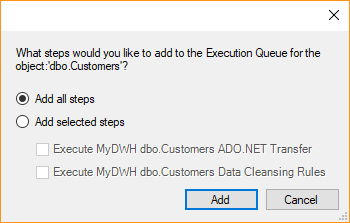
- Select Add all steps or Add selected steps and choose which steps you would like to add to the queue. Click Add to add the object to the queue.
- The object is now queued in the Execution Queue. If there is no other items in the queue, the object will be moved to In Progress and begin executing immediately.
Pausing and running the queue
The Execution Queued mode can be toggled between running and pause using the button in the top right corner of the window. When the queue is running, the button is called Pause. Clicking the button prevents further objects from being executed and changes the button text to Resume. Pressing Pause does not stop an object that is currently in progress. Pressing the Resume button resumes executing of the queue.
Moving and Removing Queued Items
The Queued list shows the items waiting to be executed.
The queued objects can be moved up and down in the list by selecting the item and using the Move up and Move down buttons. The top item in the list is the next to be executed.
An object can be removed from list by selecting it and clicking Remove. Clicking Clear removes all items from the list.
Stopping Current Execution
In Progress shows the object currently being executed. Pressing Stop halts the execution of the object and pauses execution of the queue.
Removing executed items and viewing errors
The Completed list shows the objects that have been executed. It lists the Status of the individual items, the Duration and the Start Time. The items can have one of four statuses:
- Success: The object was executed without errors.
- Failed: The execution was ended prematurely by an error.
- Stopped: The execution was stopped by the user before it completed.
You can view error messages for failed objects by selecting the object in the list and clicking View Error. This brings up a message box displaying the error message.
Closing the Execution Queue Window
You can close the Execution Queue window by clicking the X in the top right corner.
Closing the Execution Queue window or closing the entire project does not stop or pause the execution of the queued objects. It only hides the window, while the Execution Queue will continue working in the background. You can open the Execution Queue window again to review the status of the objects in the queue or to add more objects to the queue.
When you close TimeXtender, the Execution Queue will be stopped along with the rest of the application.
0 Comments