Note: This troubleshooting technique applies to sandbox testing. Since attaching/ detaching a debugger may stop a running process, you should be careful when using these tools.
This article describes how to use a GUI debugger, x64Dbg or Windbg Preview, to attach to a running TimeXtender process and to review DLLs loaded, threads and call stack. This may help debug complex issues involving performance, hang or unexpected process termination.
Download x64Dbg and install it.
Get WinDbg Preview - Microsoft Store
Attach to a running TimeXtender process
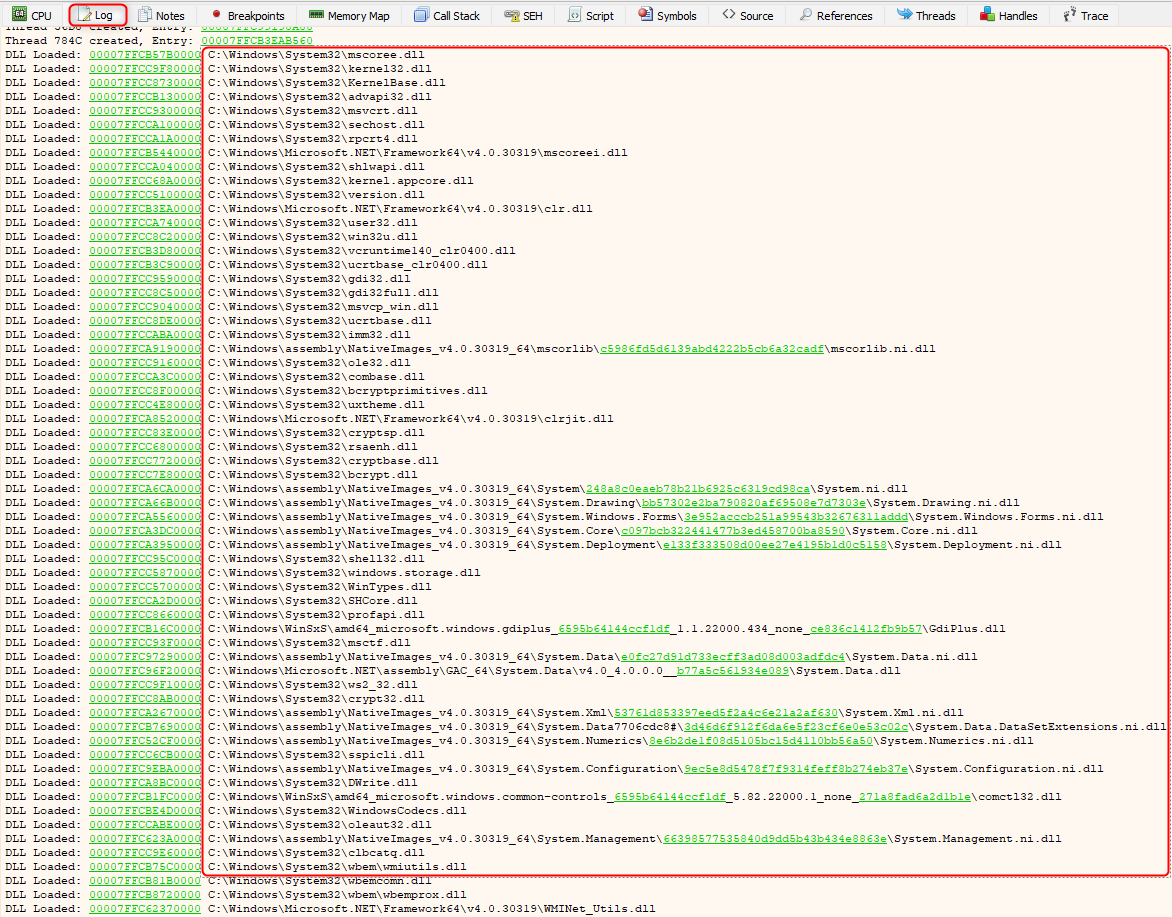
In x64Dbg tool, use File -> Attach (select TimeXtender in the list of processes)
Note: If multiple instances are running, recognize an instance of TimeXtender by project name or version

Review the list of DLLs loaded

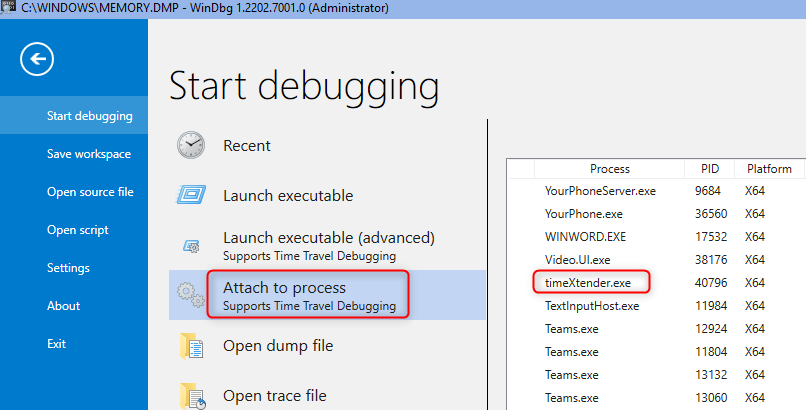
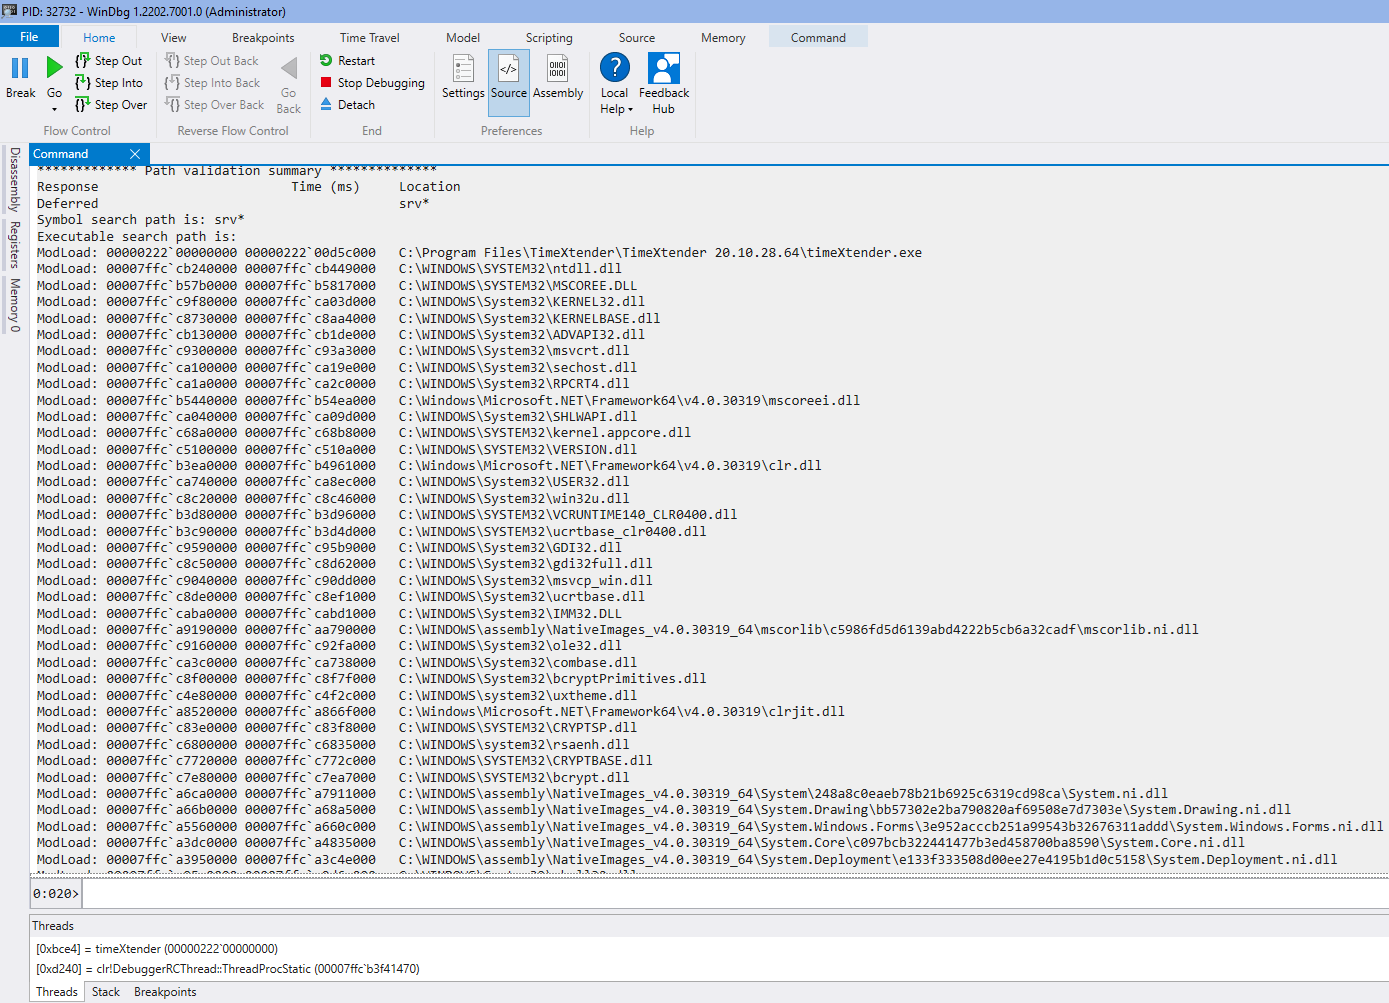
In Windbg Preview, use File -> Attach to process

This shows the list of DLLs loaded.

Generate a dump of a hung process
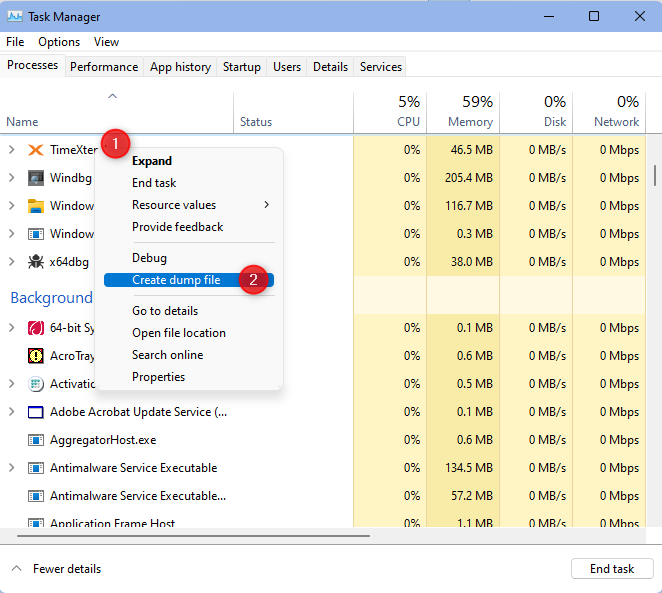
In Task Manager, right-click on TimeXtender process -> Create dump file
Note: This may generate a huge file. Use this option for a hung process only, when troubleshooting the root cause.

This dump can be further analyzed in a Windows debugger.
For example, load this dump in Windbg and perform exception analysis by this command:
!analyze -v
Reference
Debugging Using WinDbg Preview - Microsoft Docs
0 Comments