Note: There is an updated version of this article, which applies to the next generation of TimeXtender.
Scenario
Review and compare execution logs
Right-click on a package -> View Execution History Log
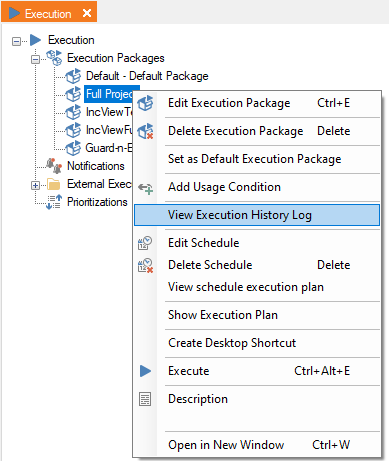
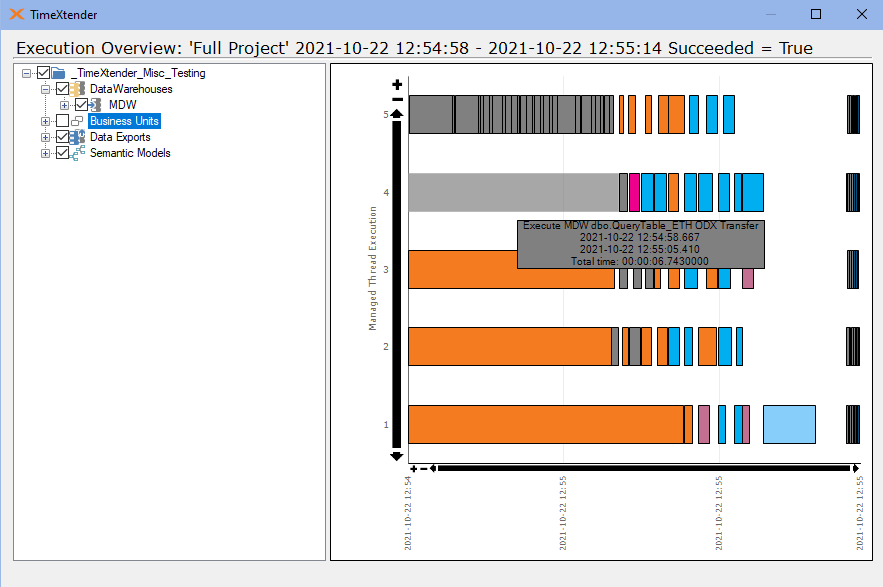
Review Gantt charts for fast and slow execution to compare objects, steps and timings. Check to see if overall number of objects or steps have increased.
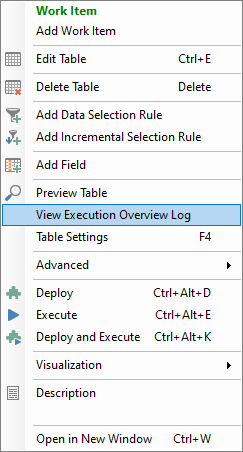
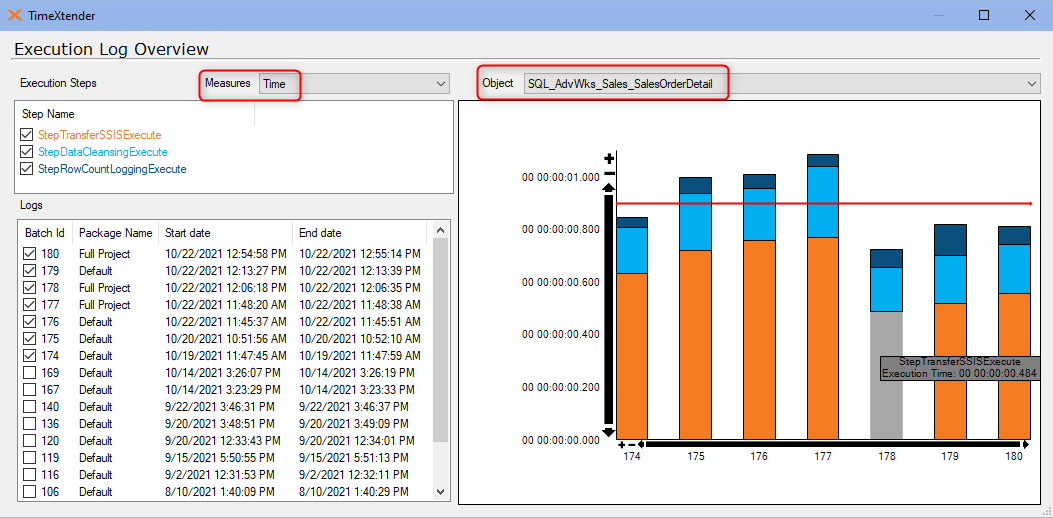
View Tools menu -> project Execution Overview Log. Review various measures and drill-down to various objects. Two examples are shown below:
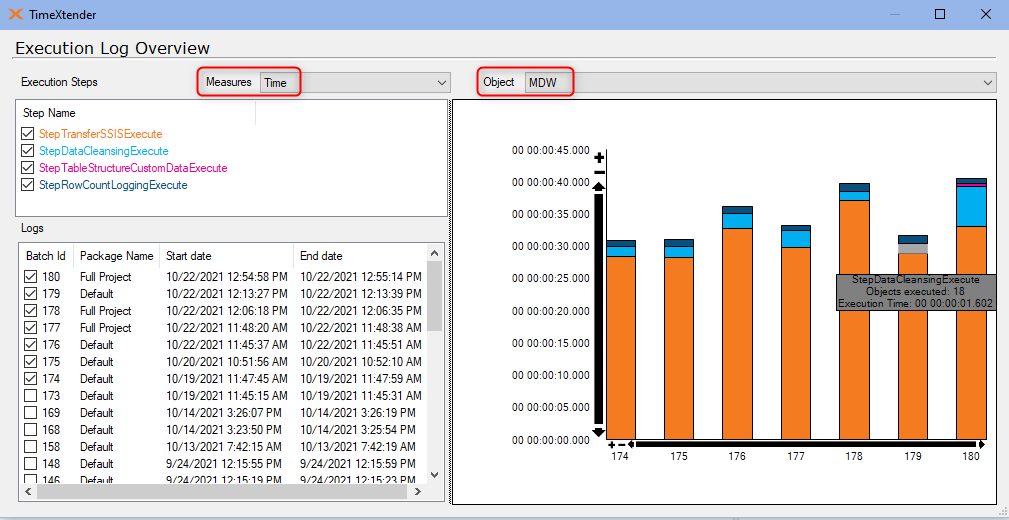
Right-Click on data warehouse or a table - > Execution Overview Log
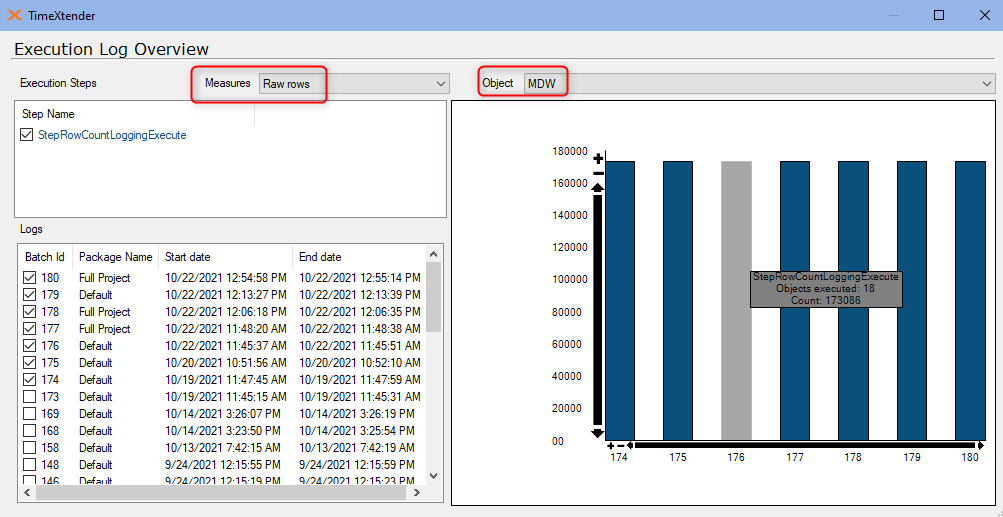
When you turn on logging (execution package settings -> Log Execution time and Log Row Count check boxes), it will shows how fast a table ran and how many rows were transferred,
Compare slow and fast executions, looking at timings and number of rows.
Check schedules, steps and overlaps
a. Trace Source => ODX and ODX => Data Warehouse:
How to Query ODX local Backlog SQLite database
b. Package Execution, Data Warehouse and Semantic Layer:
Execution Details SQL Query may return detailed execution information. It may show which step took more time.
c. Are there other packages scheduled to run with overlapping schedules?
Scheduled Execution issues - Did it not start, did it fail, or is my execution still running?
Is my scheduled execution running
Review the FAQ in Troubleshooting concurrency issues in ODX data sources
Environment, machine and network factors
Review Windows Event Viewer logs for errors or warnings related to ODX Service and TimeXtender Scheduler Service.
When reading data from another machine, look for these factors when applicable:
- network latency
- CPU/ memory on other machine
- memory allocation for SQL server (for large executions)
- reboots, server maintenance, nightly patching (if any)
- retries on the package
- intermittent connectivity issues to Azure server
Check for blocking
Use a Profiler tool to trace SQL queries in currently executing package.
Understand and resolve blocking problems
Understand and resolve Azure SQL blocking problems
Number of Threads: lower the number of concurrent execution threads on ODX data source
Redesign: split data sources and/or execution packages to avoid interdependency of data sources
implement incremental load for loading big tables.
If your ODX storage is on a SQL database, consider moving it to Azure Data Lake, even if the data warehouses are on-premises.
Tune SQL Server performance - adjust relevant parameters which affect concurrency and memory consumption to give extra room for non-SQL processes from TimeXtender and ODX services.
Is Repository or old logs size affecting performance?
Why is my project repository database so large, and how can I shrink it?
Periodic maintenance
Right click on the Project Node -> Performance Recommendations -> Find...
2. Right click on the Project Node -> Advanced -> SQL Database Cleanup Tool
3. also review "Proactive maintenance, cleanup & backup" section in this article
Self-Service Troubleshooting in TimeXtender
Reference
Scheduled Execution issues - Did it not start, did it fail, or is my execution still running?

2 Comments